March 2, 2026
Cementitious vs Liquid Waterproofing
Cementitious vs Liquid Waterproofing – Which Performs Better in Middle East? Waterproofing failure in the Middle East is rarely a...

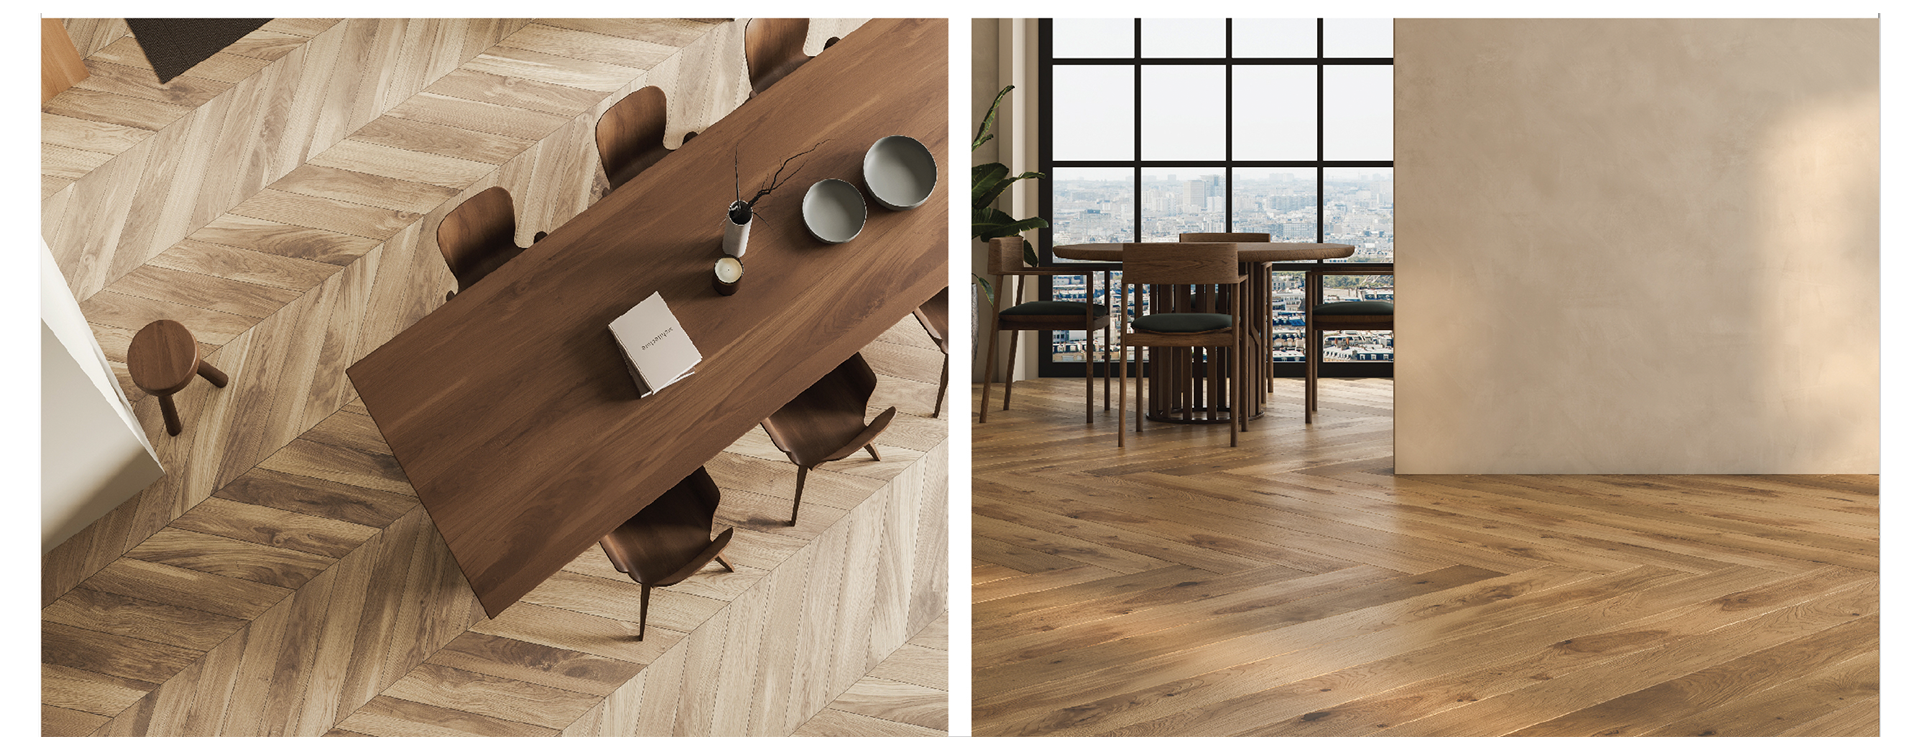
Why Commercial Projects Are Moving Beyond Ceramic Tiles ?
The global flooring market crossed USD 360 billion in 2024, driven by large-scale urban construction, commercial interiors, and continuous refurbishment of retail and office spaces. Within this market, resilient and rigid-core flooring products are steadily gaining share, gradually replacing traditional ceramic tiles in many commercial applications.
One of the fastest-growing segments in this transition is Stone Plastic Composite (SPC) flooring. Industry estimates suggest the global SPC flooring market is expanding from around USD 5 billion in 2025 to nearly USD 15 billion by 2032, supported by strong demand from offices, retail chains, hospitality, healthcare, and institutional buildings.
This shift is not driven by aesthetics alone. It is driven by how commercial buildings are built, operated, and refurbished today.
The Three Pressures Reshaping Commercial Flooring Decisions :
Commercial flooring decisions are increasingly influenced by constraints that ceramic tiles were never designed to address.
1. Compressed Construction & Fit-Out Timelines :
Modern malls, offices, and hotels operate under aggressive schedules. Flooring delays directly impact opening dates, lease handovers, and revenue generation.
2. Rising Expectations for Comfort & Maintenance :
Commercial interiors now prioritize acoustic comfort, ease of cleaning, and consistent appearance, especially in offices, clinics, education facilities, and retail spaces.
3. Minimizing Downtime During Renovation :
Retail brands, hospitality operators, and corporate offices frequently refresh layouts. Flooring systems that require demolition, curing, and extended closure windows are becoming commercially unattractive.
SPC flooring addresses all three pressures simultaneously, while ceramic tiles increasingly struggle to do so.
SPC vs Ceramic Tiles: Installation, Time & Downtime
| Aspect | Ceramic Tiles | SPC Flooring (Rigid Core) |
|---|---|---|
| Installation method | Wet installation (mortar & grout) | Dry, floating click-lock system |
| Subfloor preparation | High; leveling & curing required | Can float over existing surfaces |
| Install speed | 3–5 days / 100 m² | 1–2 days / 100 m² |
| Business downtime | High | Low; immediate use |
| Skill dependency | Specialist tilers | General flooring crews |
For retail stores and office refurbishments, faster SPC installation means lower lost revenue and reduced project overheads.
Read More About GCC’s Laminates Product
Pre‐FTA Pricing: India’s Edge Is Neutralised by Duties
India’s manufacturing costs are competitive today, but duties create a barrier. Here’s a detailed table across 10+ categories :
| Product Category (Bulk B2B) | Origi n | Approx. Ex‐Factory/FOB 2024 | Typical EU MFN Duty* | Est. Landed Cost Band** | India’s Current Edge |
|---|---|---|---|---|---|
| Ceramic/Vitrifie d Tiles (per m2) | China | US$4.10 | 0–2% | US$4.40 – 4.55 | – |
| Ceramic/Vitrifie d Tiles (per m2) | India | US$3.30 | 8–10% | US$4.55 – 4.70 | 20% cheaper ex‐works |
| Iron/Steel Flat Products (per MT) | China | US$620 | 0–3% | US$660 – 680 | – |
| Iron/Steel Flat Products (per MT) | India | US$560 | 7–9% | US$680 – 700 | 10% cheaper ex‐works (+3.18M tons shipped) |
| MS Sheets/Rebars (per MT) | Turkey | US$550–630 | 0% | US$600 – 680 | – |
| MS Sheets/Rebars (per MT) | India | US$560 | 7–9% | US$680 – 700 | Comparable ex‐works |
| PVC Pipes/Fittings (per MT) | China | US$920 | 0–2% | US$970 – 990 | – |
| PVC Pipes/Fittings (per MT) | India | US$780 | 6–8% | US$900 – 940 | 5% cheaper ex‐works |
| Cement (bulk, per MT) | Turkey | US$68 | 0% | US$75 – 78 | – |
| Cement (bulk, per MT) | India | US$52 | 8–10% | US$68 – 72 | 24% cheaper ex‐works |
| HPL Laminates (per m2) | China | US$4.20 | 0–3% | US$4.50 – 4.70 | – |
| HPL Laminates (per m2) | India | US$3.80 | 7–9% | US$4.70 – 4.95 | 10% cheaper ex‐works (EU market US$11.4B) |
| Plywood (export grade, per m3) | China | US$420 | 0–4% | US$460 – 490 | – |
| Plywood (export grade, per m3) | India | US$380 | 6–8% | US$450 – 485 | 10% cheaper ex‐works (global exports US$1.48B) |
| Furniture Hardware (SS) hinges,(1,000 pcs) | China | US$180 | 0–3% | US$200 – 210 | – |
| Furniture Hardware (SS) hinges,(1,000 pcs) | India | US$160 | 7–9% | US$210 – 225 | 11% cheaper ex‐works |
| Construction Chemicals (admixtures/kg) | China | US$1.10 | 0–2% | US$1.20 – 1.25 | – |
| Construction Chemicals (admixtures/kg) | India | US$1.40 | 6–8% | US$1.60 – 1.70 | Comparable (market US$48B→72B) |
| PVC Foam Boards/WPC (per m2) | China | US$4.50 | 0–3% | US$4.90– 5.20 | – |
| PVC Foam Boards/WPC (per m2) | India | US$4.00 | 6–8% | US$4.80 – 5.20 | 11% cheaper ex‐works |
| Plasticware (watertanks/bins, per unit) | China | US$15–25 | 0–2% | US$17 – 28 | – |
| Plasticware (watertanks/bins, per unit) | India | US$12–20 | 6–8% | US$16 – 25 | 20% cheaper ex‐works |
* Indicative MFN ranges. ** Assumes standard freight/handling. Sources: GCC guides, COMTRADE 2024, Statista.
Reality check: India is already shipping significant volumes (e.g., 3.18M tons steel, ceramics US$427M), but duties neutralise the 10–24% ex‐factory edge across categories, keeping China/Turkey dominant on landed cost.
Read More About GCC’s Construction Chemcial Range
Step 1: Policy Context – Why Change Is Coming
The EU–India FTA will phase down duties on 90%+ of tariff lines over 5–10 years, including industrial goods like steel, ceramics, plastics, wood products, and chemicals—following precedents like EU–Vietnam (50%+ export growth post‐tariffs).
Simultaneously :
Result : India’s current volumes (US$5.68B steel, US$427M ceramics, etc.) are set to accelerate as duties fall and risks rise elsewhere.
Step 2 : Post‐FTA Pricing Scenarios – Slow Math Breakdown
Assume duties on Indian lines drop to 0–2% over time (realistic per EU FTAs). Here’s the transformation, category by category :
Likely Post‐FTA Landed Cost Shift Table (Illustrative)
 1
1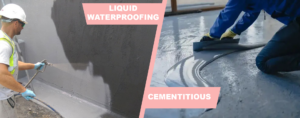
 0
0 0
0 0
0